Source: Dealogic. Data period: Jan 1-Dec 31. Value: $ million.
Biggest four sectors by region 2017

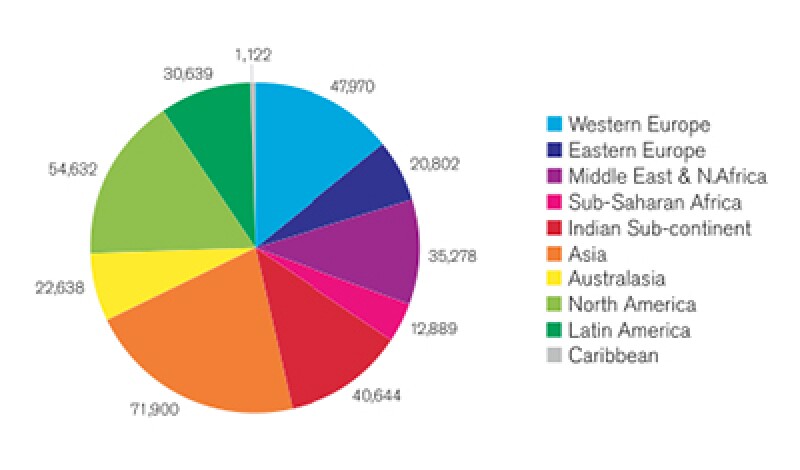
By region in 2017
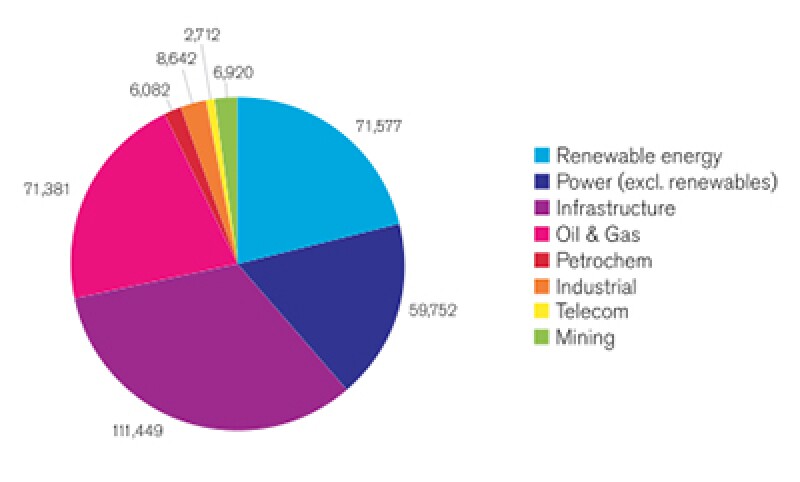
By sector in 2017
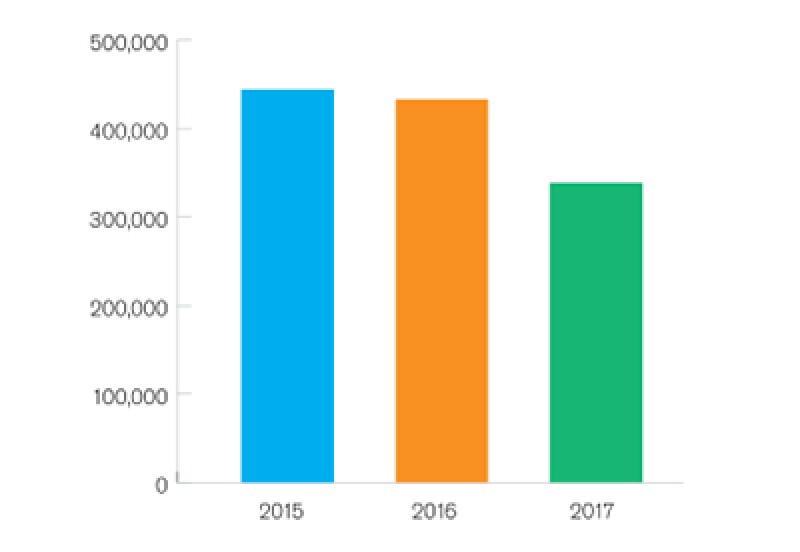
Totals 2015-2017
Top 10 countries for project finance 2017
Country |
$ million |
No. of deals |
US |
43 871 |
128 |
India |
38 264 |
279 |
China |
33 585 |
24 |
Australia |
22 472 |
52 |
Indonesia |
17 922 |
19 |
Russia |
16 611 |
3 |
UK |
13 640 |
46 |
Brazil |
13 330 |
149 |
Canada |
10 761 |
28 |
Mozambique |
10 393 |
3 |